Water Monitoring Dashboard
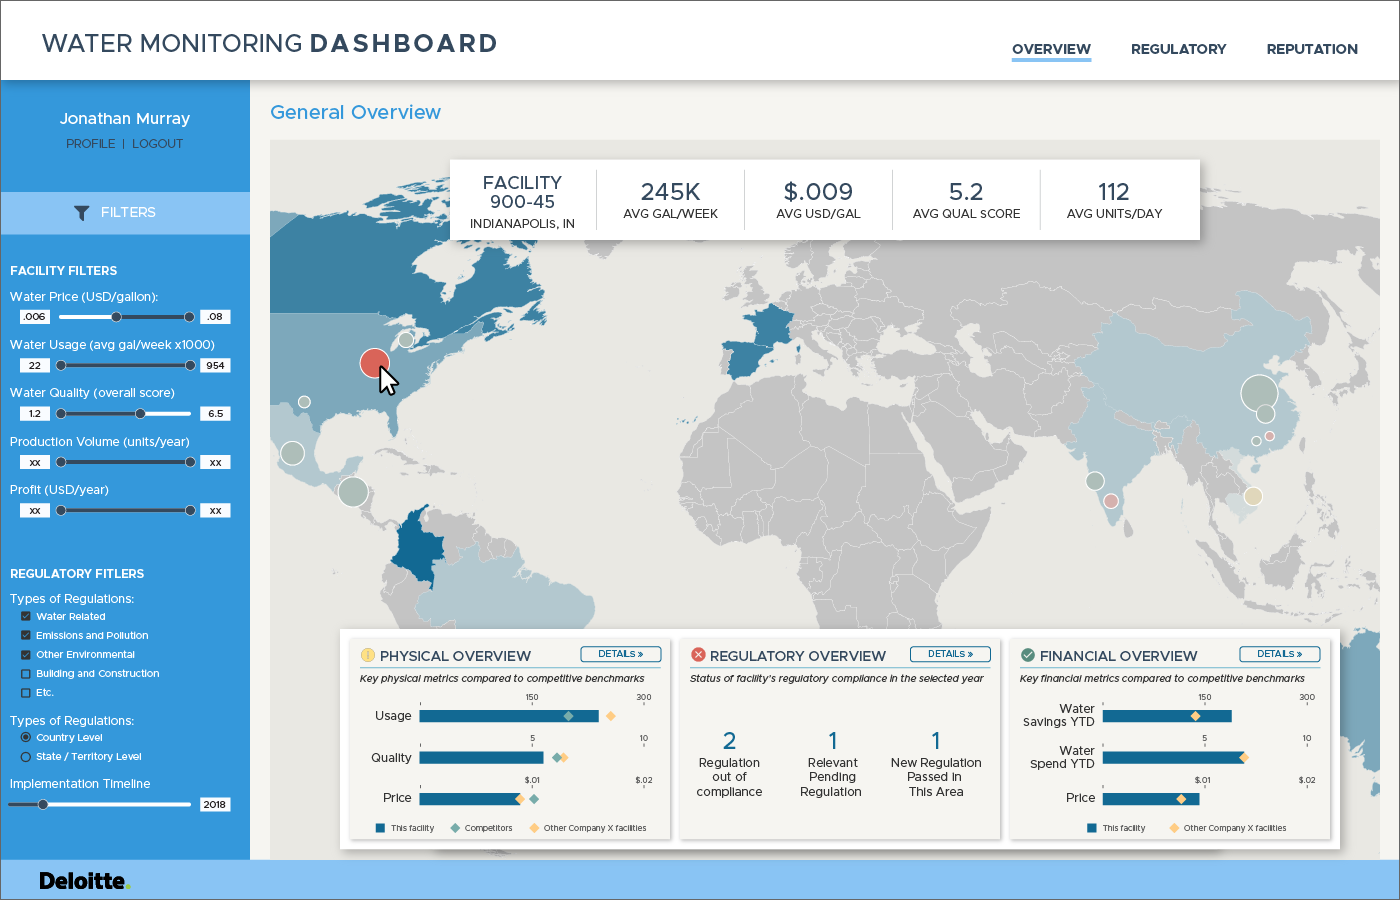
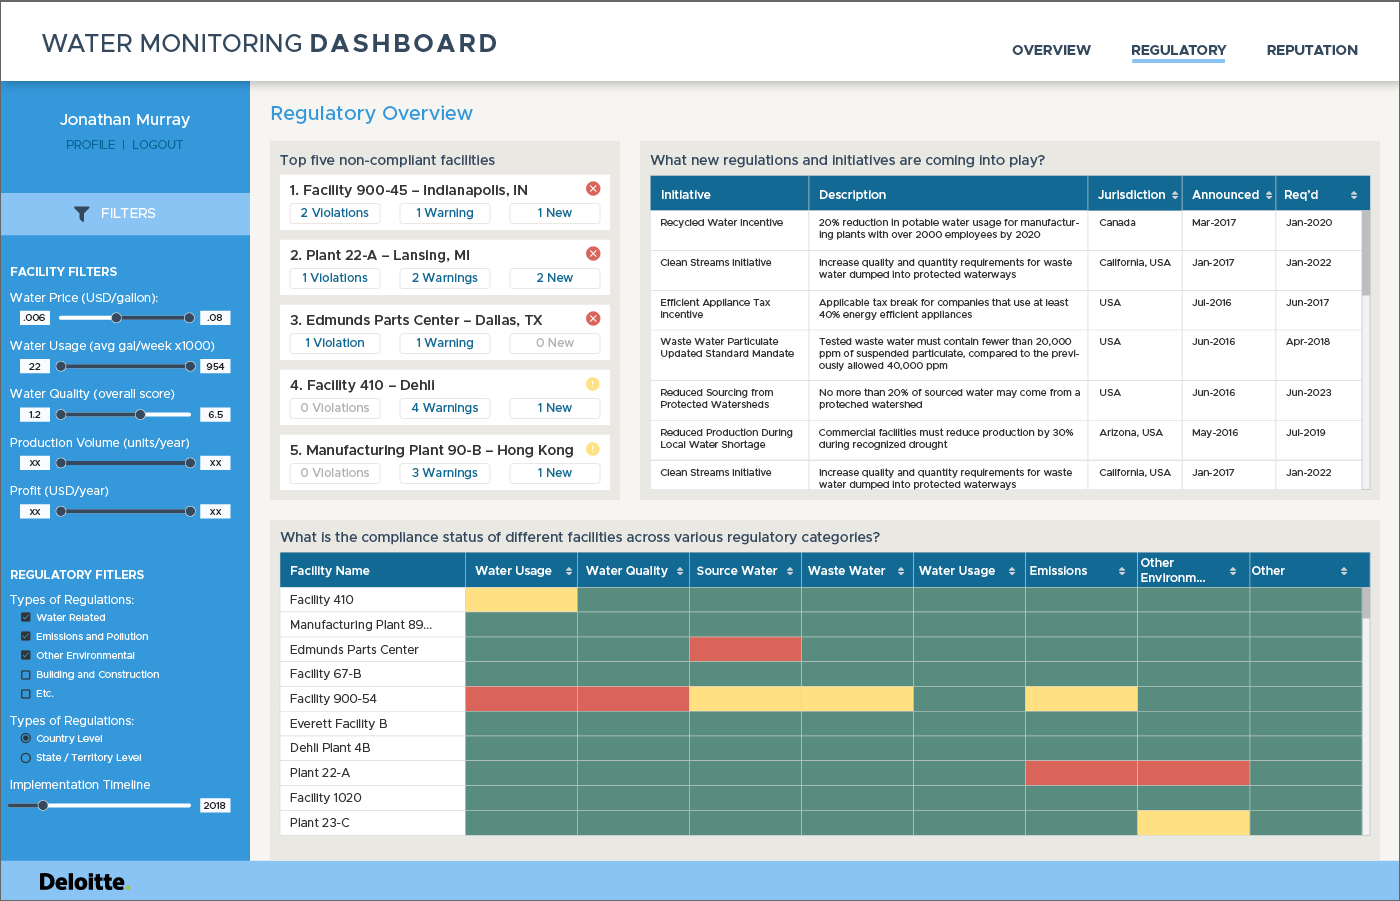
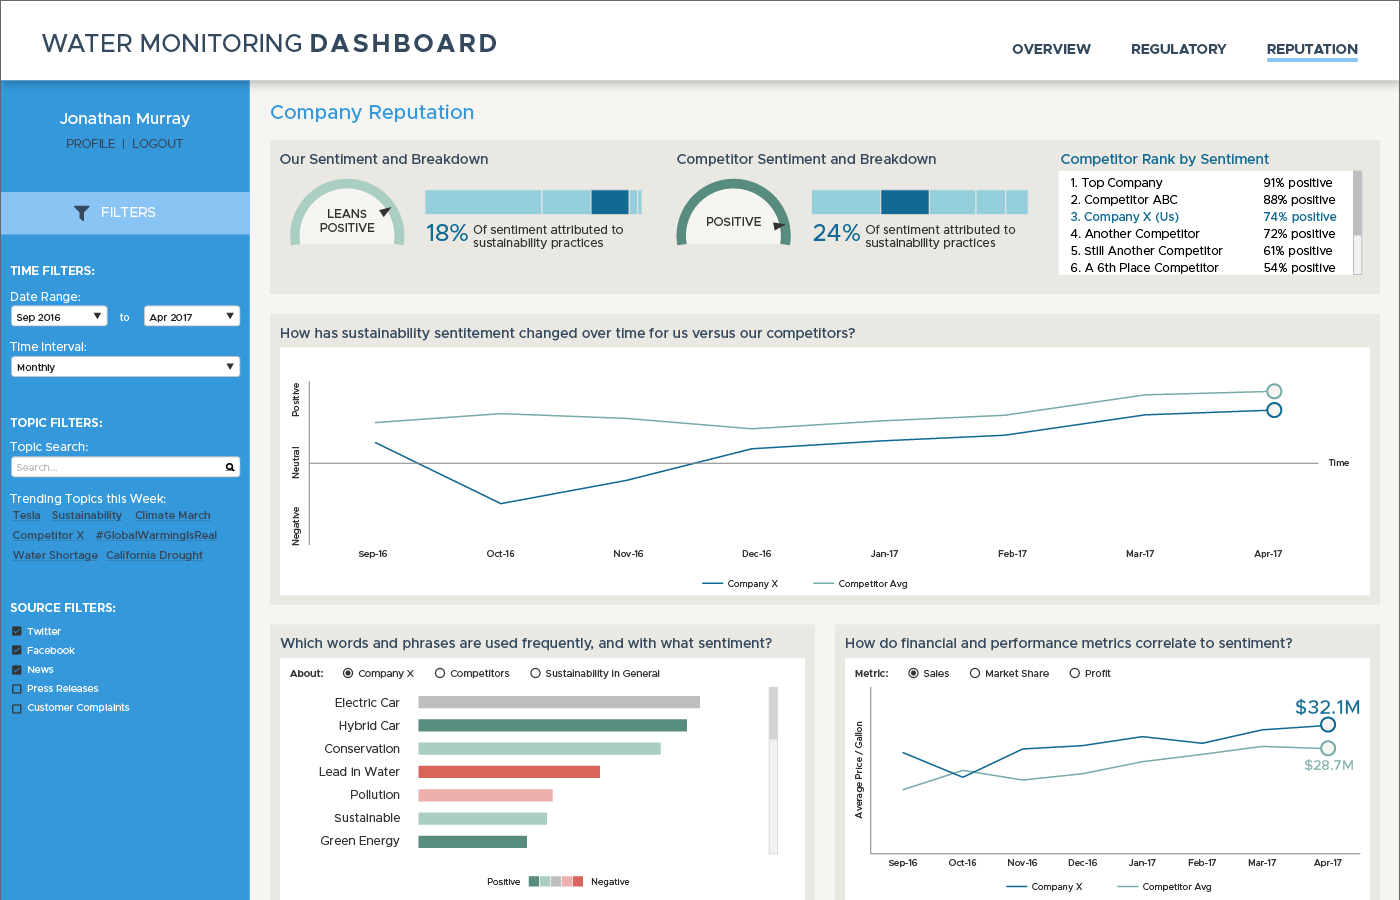
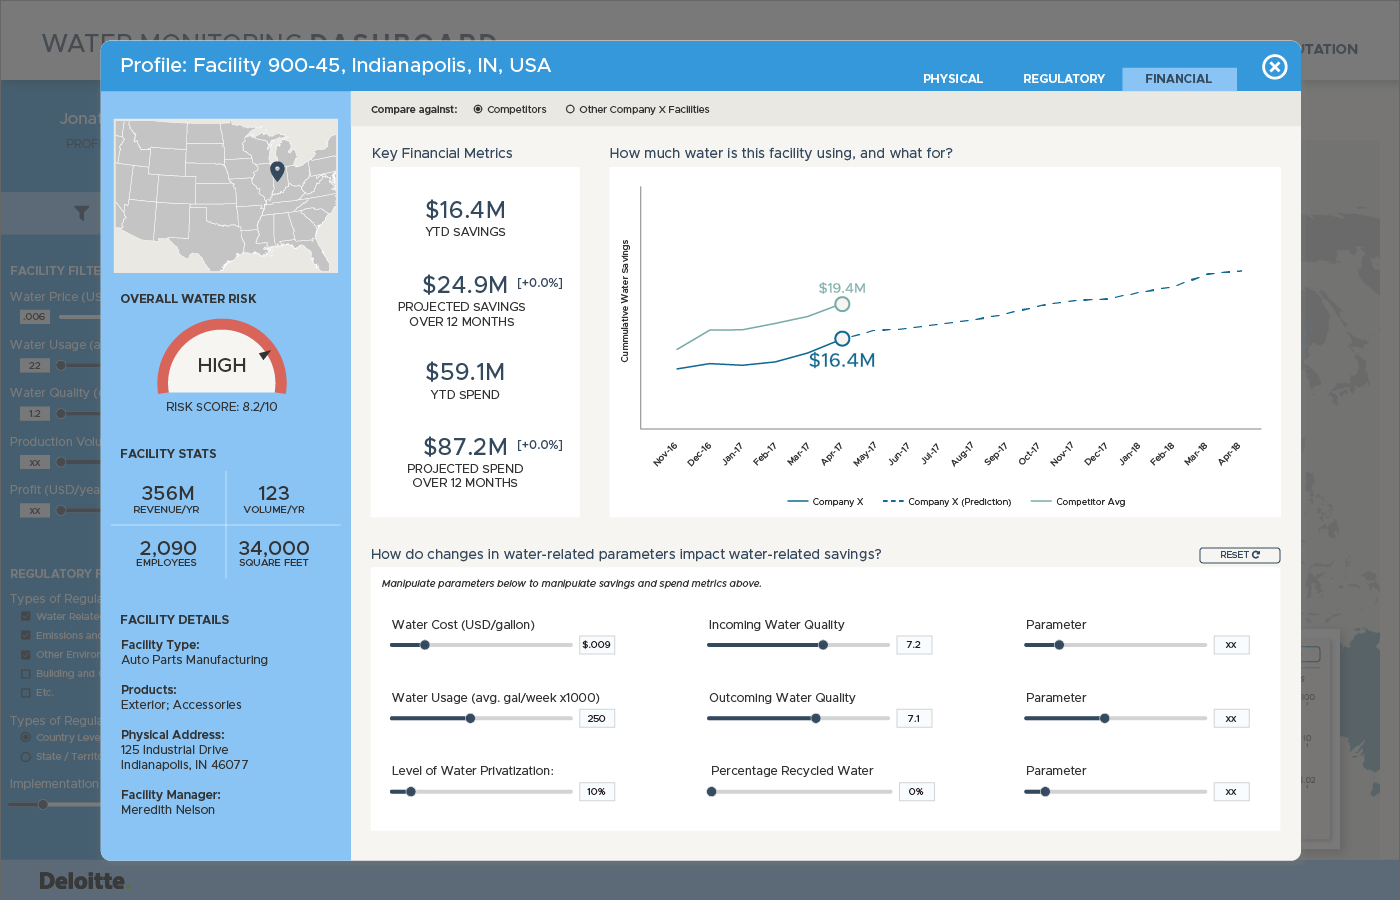
Sometime it's hard to convey the power of a complicated technology to clients. People need to see something for it to be real. For this project with a global energy provider, seeing was believing. Deloitte had developed a robust strategy and planned the backend technology that would be needed to power a web-based SaaS tool for the client's customers to monitor and reduce their water consumption and maintain compliance with applicable regulations. However, the enticing technology wasn't enough to sell the project—the client wanted to see what it could look like. In order to win the proposal, I worked with our strategy team to put together a concept prototype for what this technology could actually feel like in the hands of a user. Over 2 weeks, I mocked up a concept that was used in a CEO presentation to sell the project—and it worked.
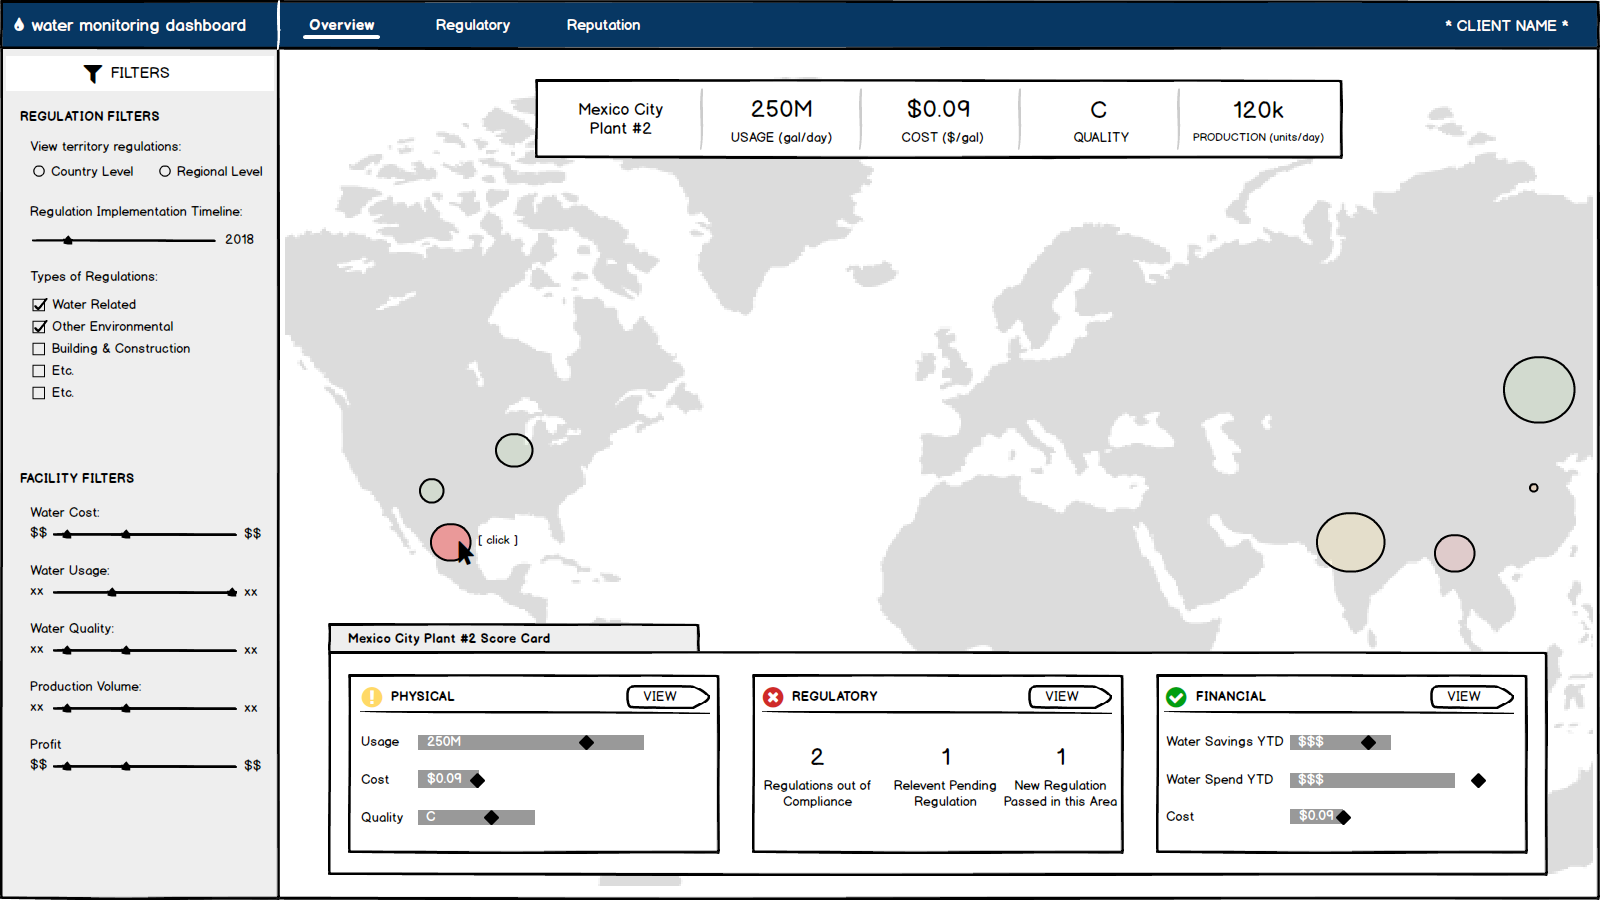
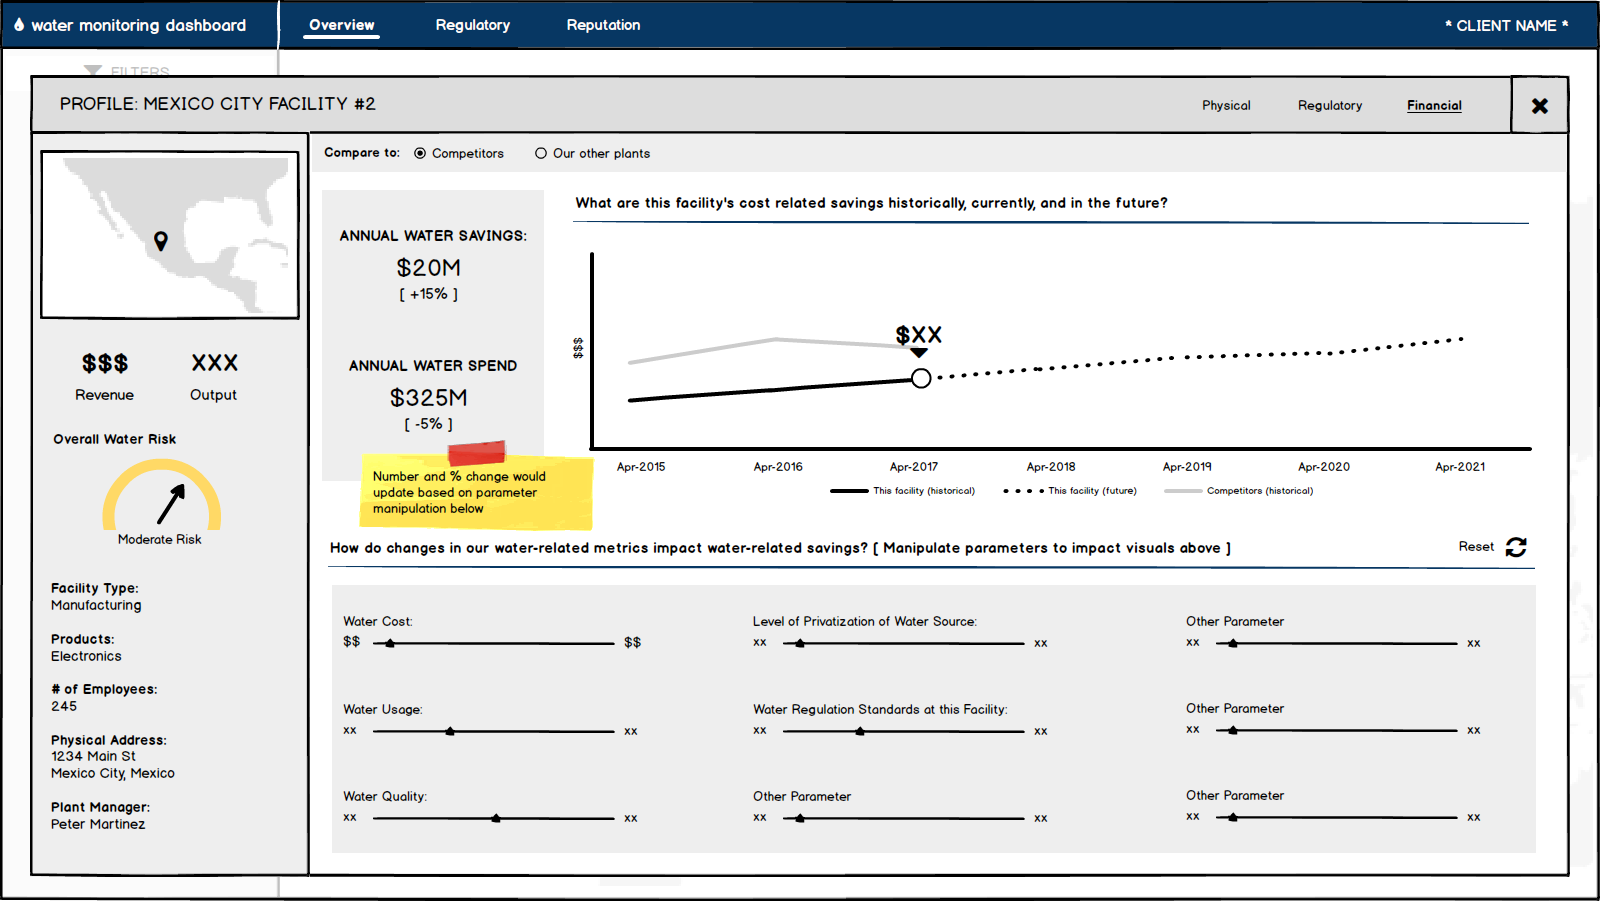
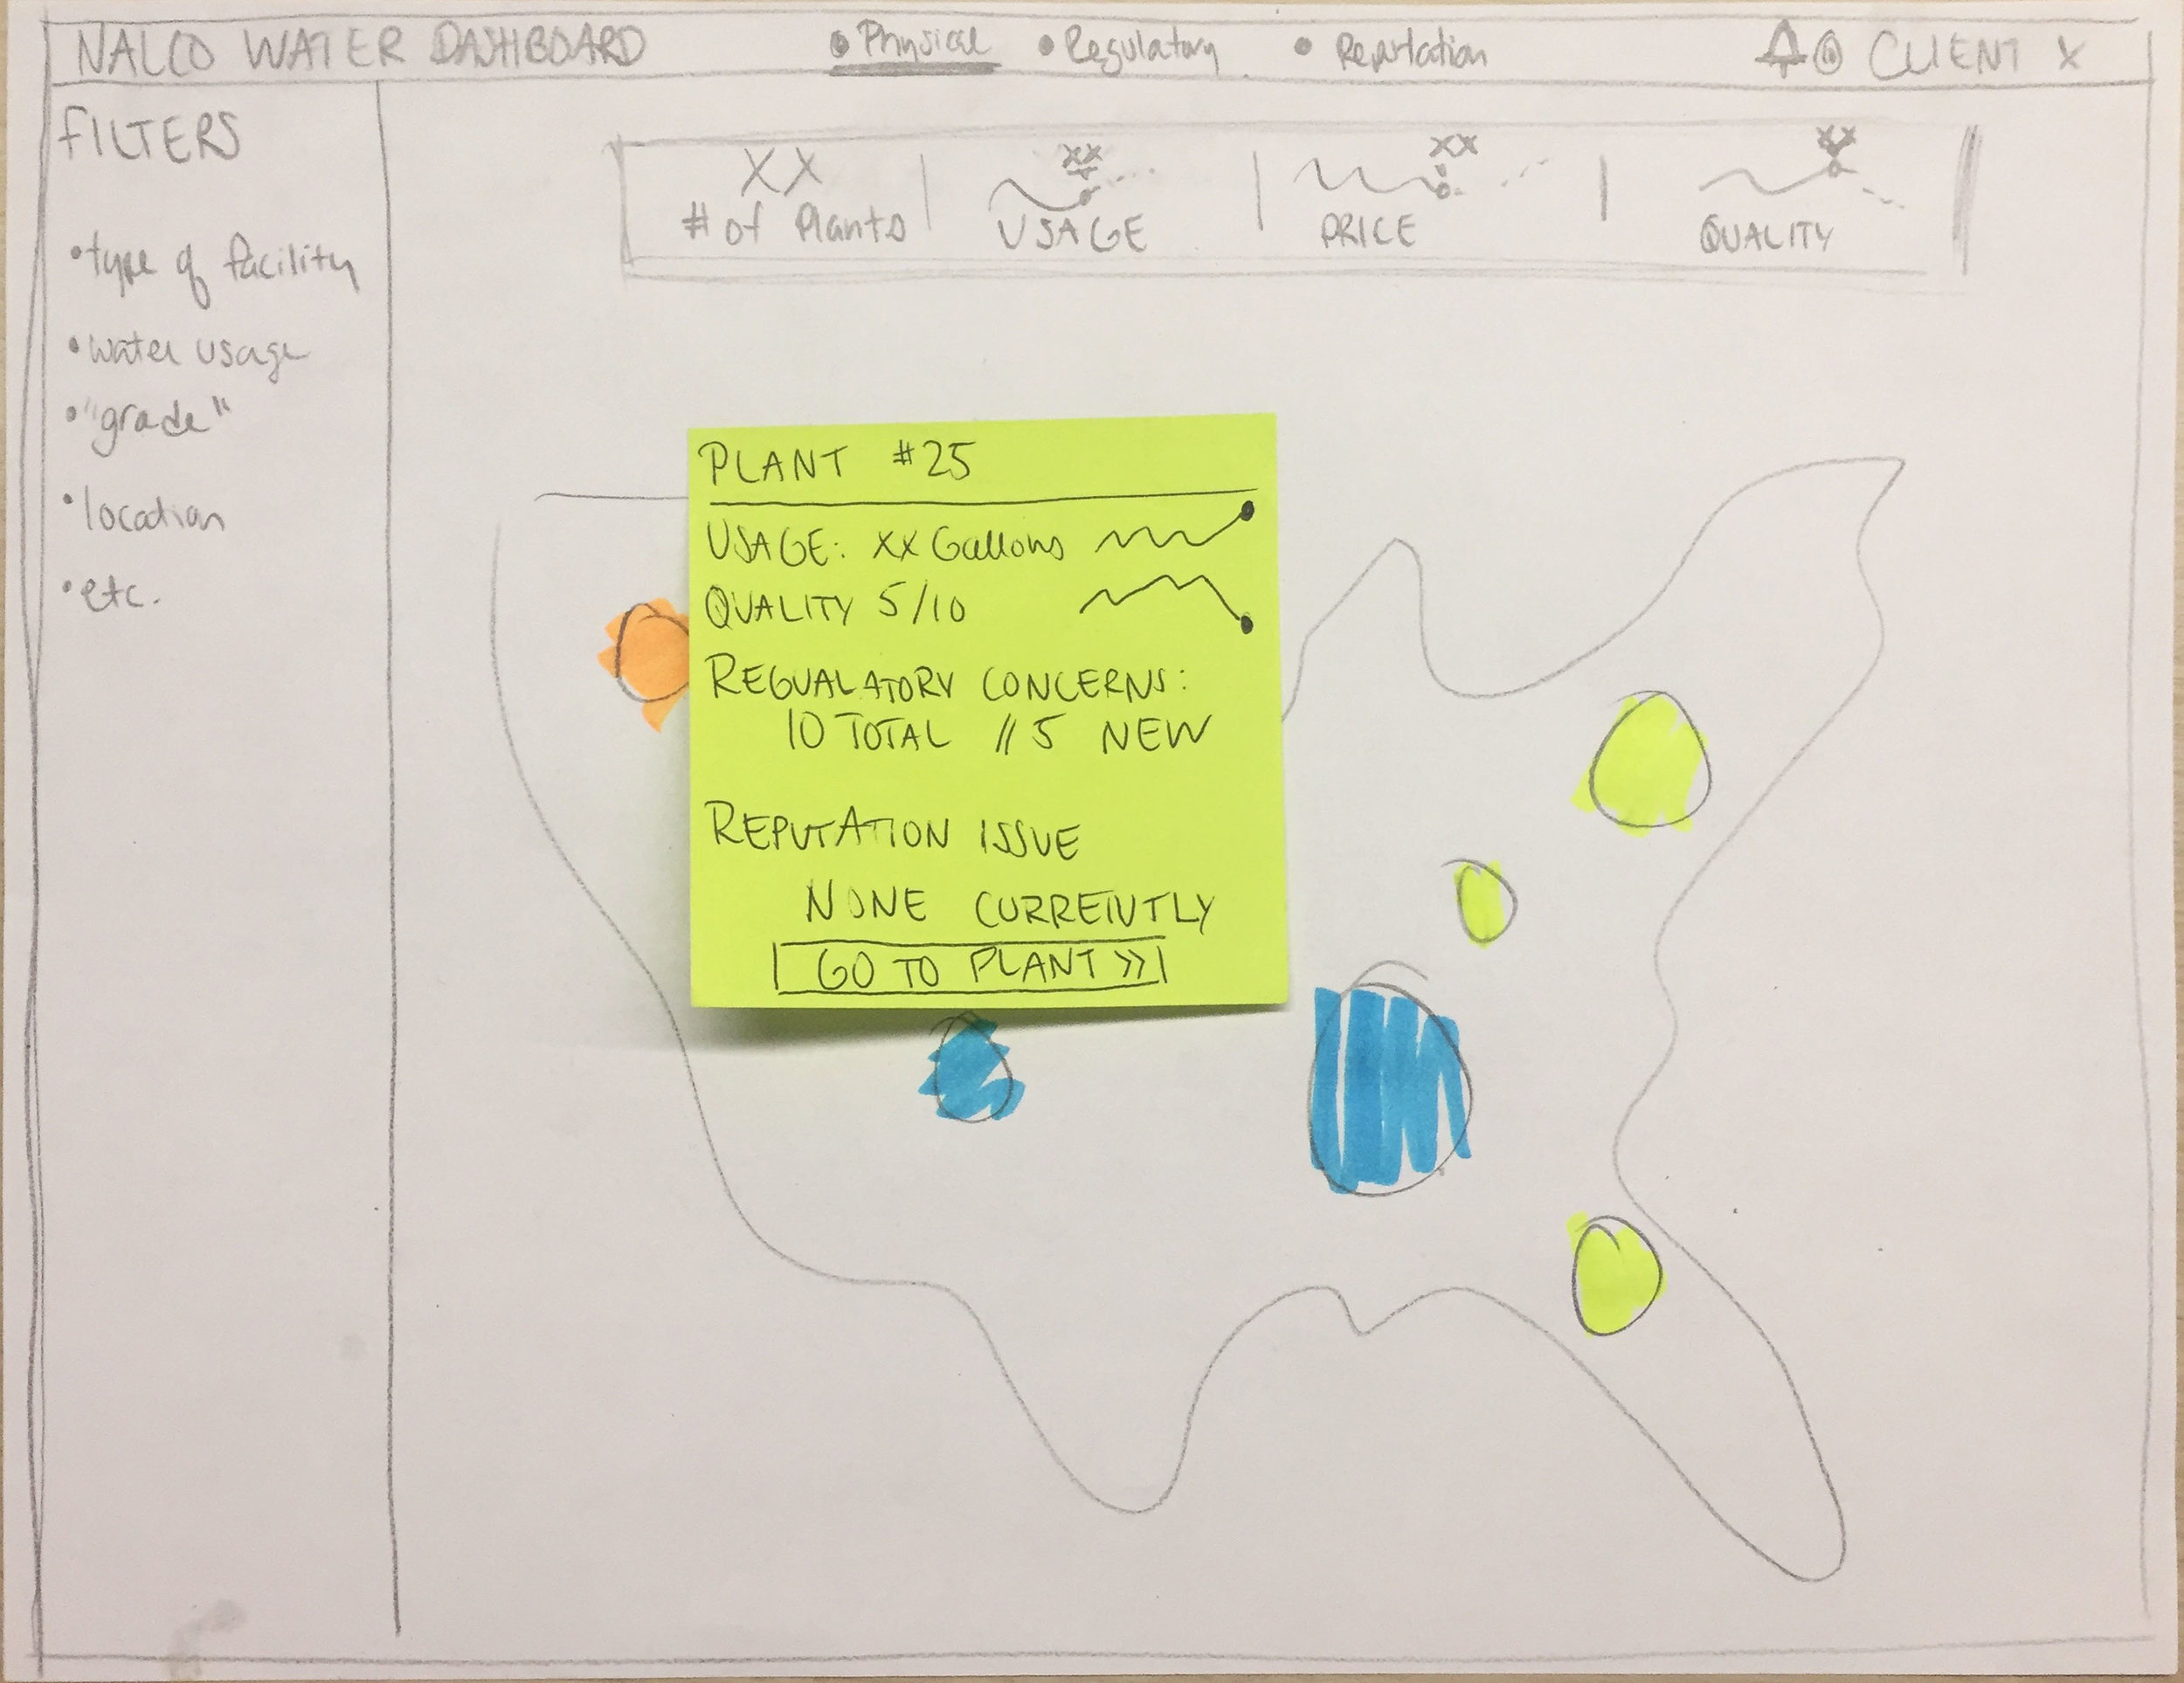
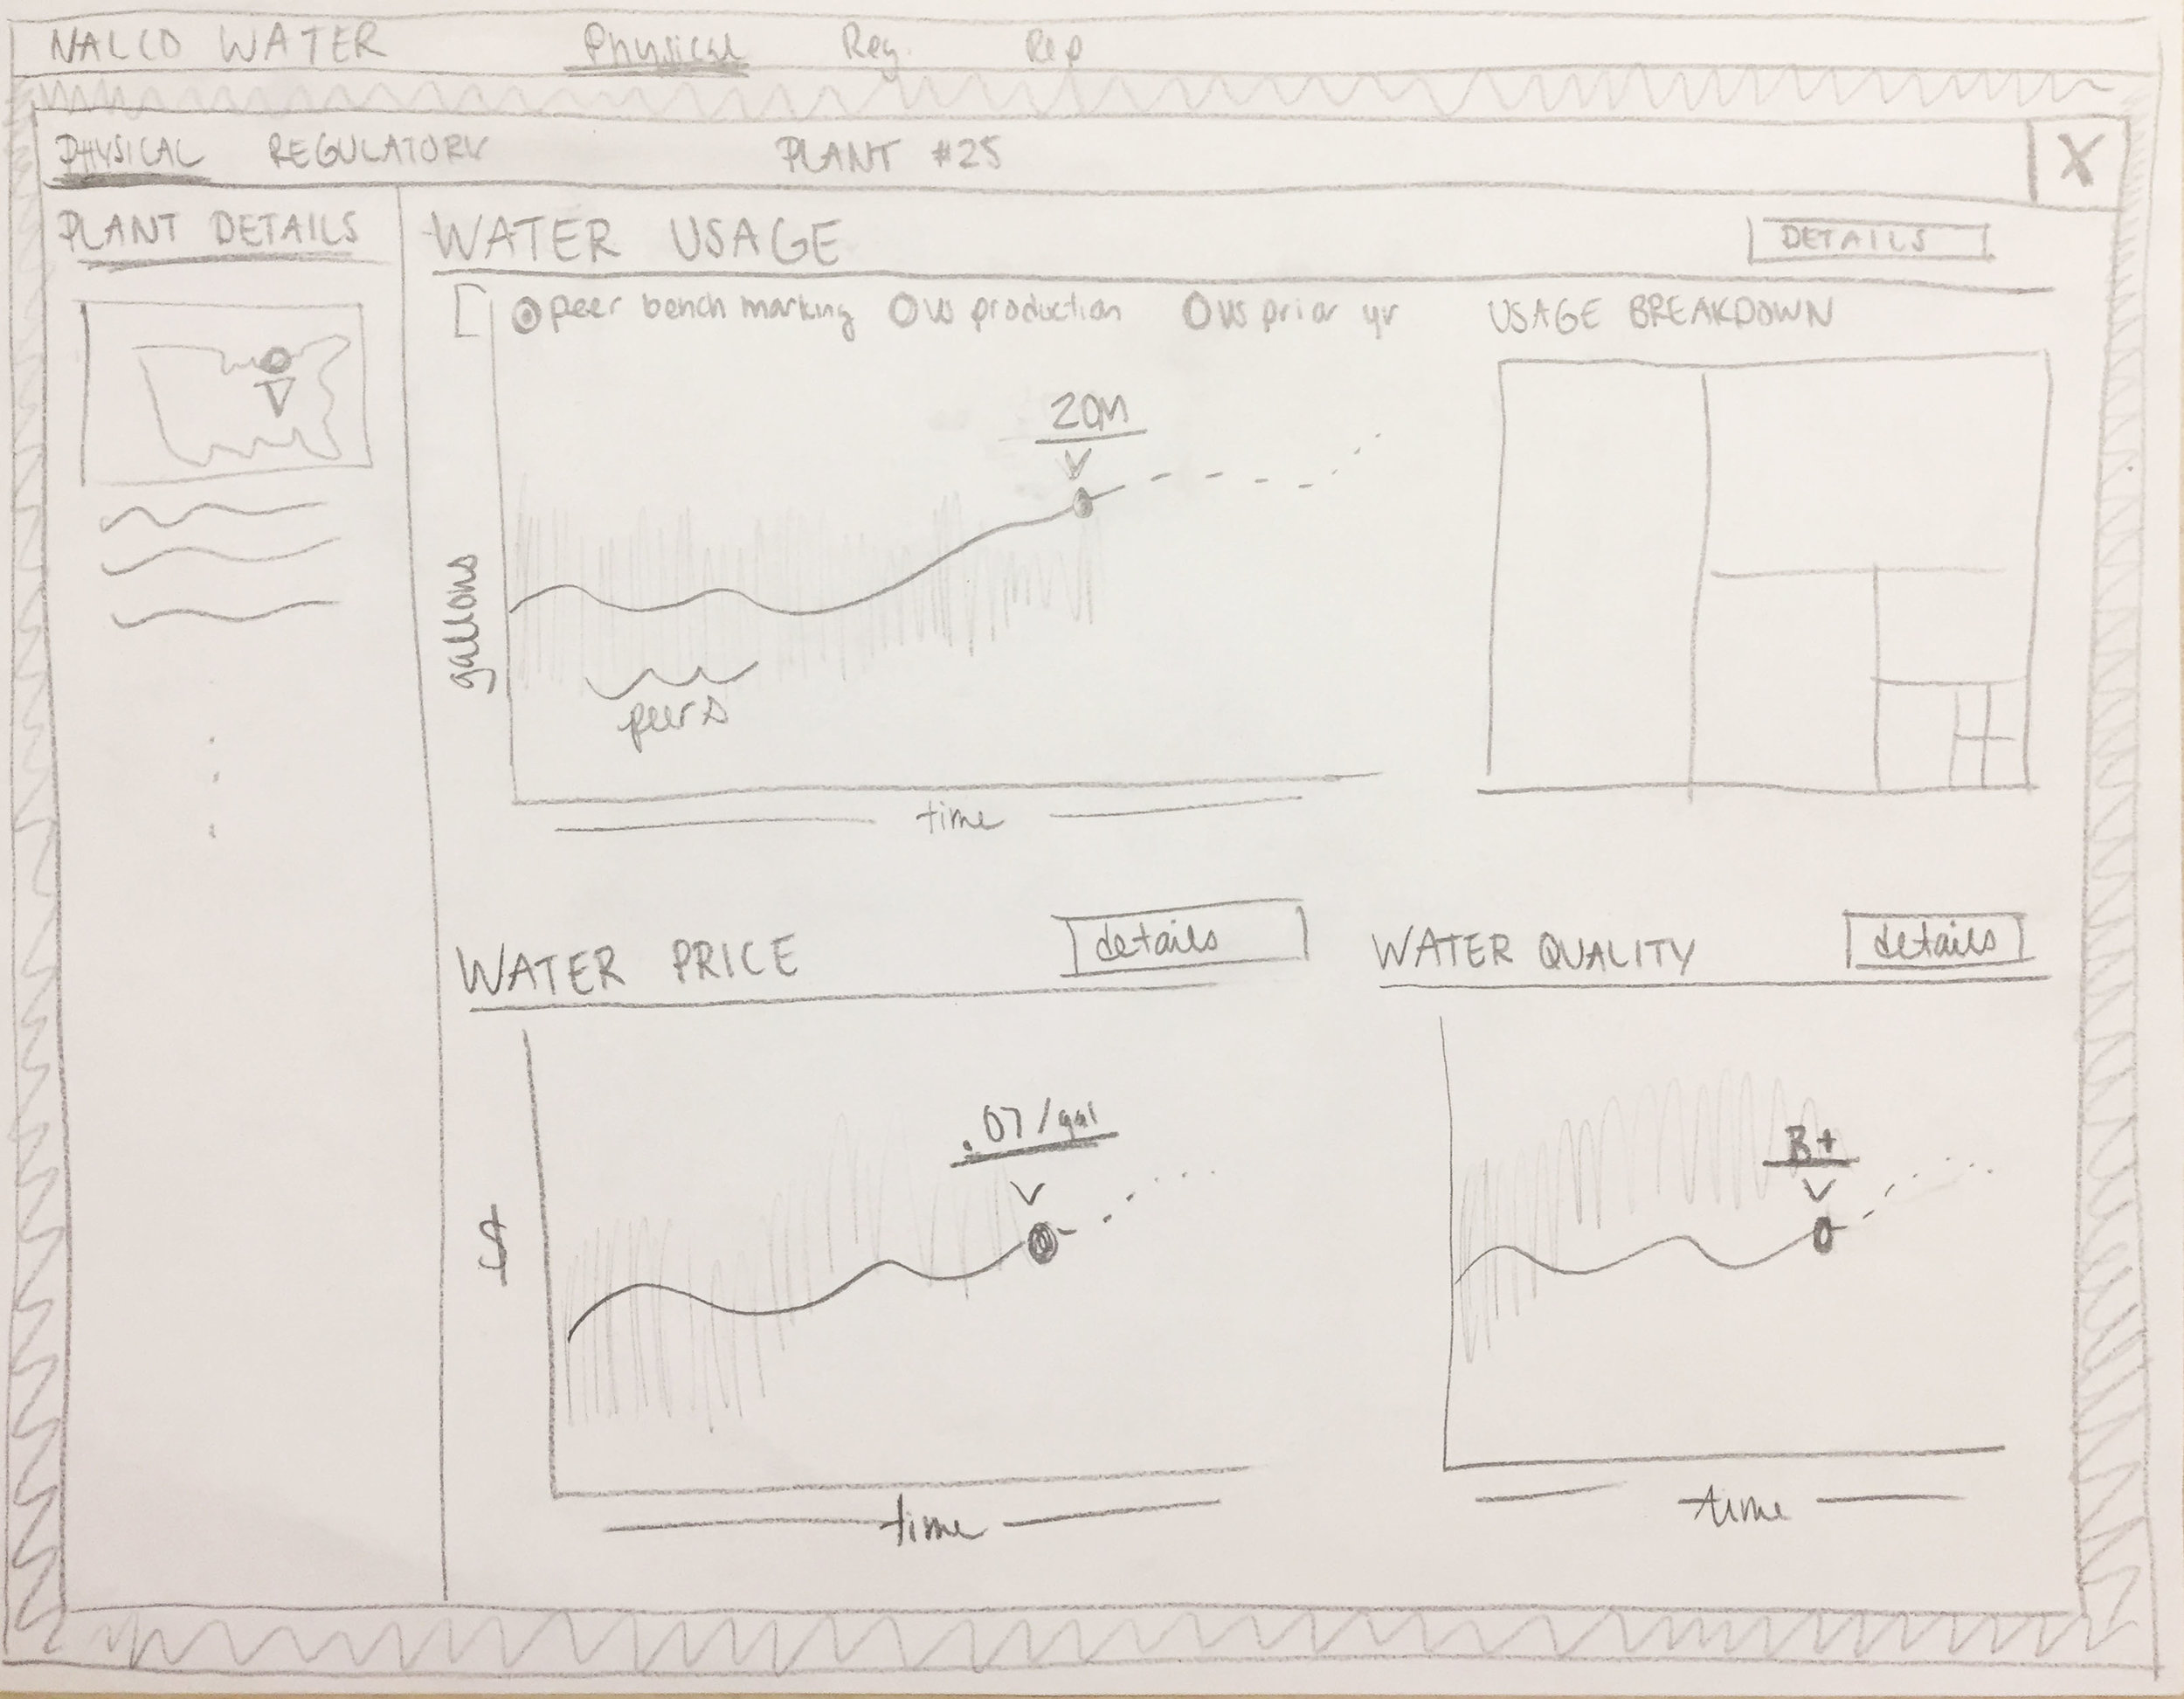
Planning and Lo-Fidelity Wireframes
With not much time to pull off this effort, I hit the ground running. After a few truly rugged paper sketches, I jumped into Balsamiq and began getting organized. Attentive feedback from collaborators made for a quick turnaround of fairly detailed concepts.
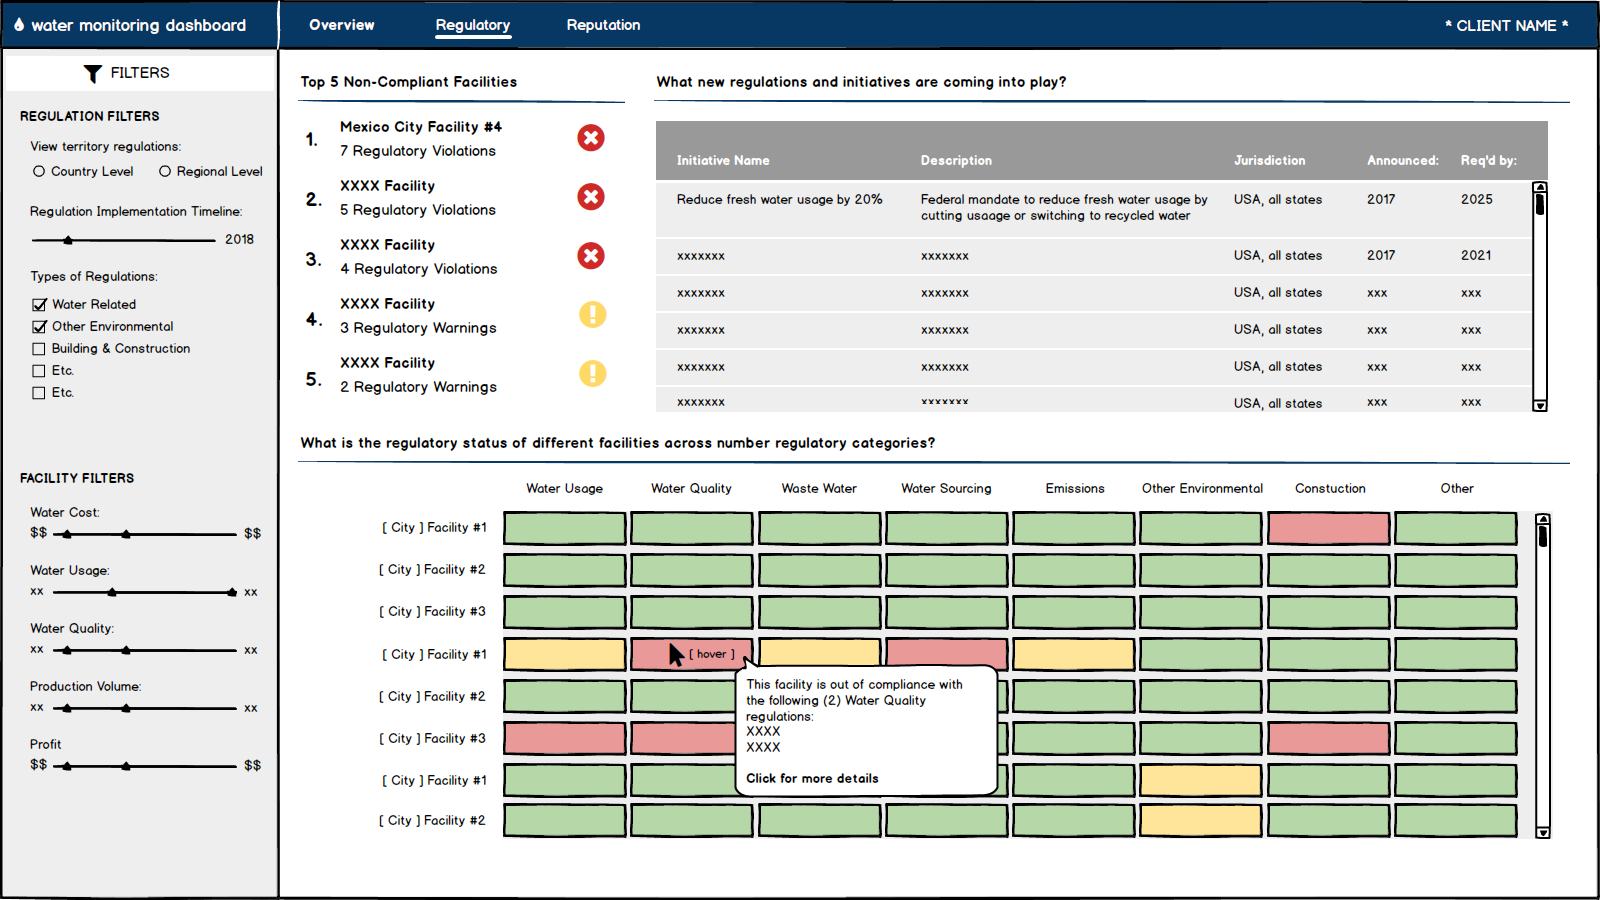
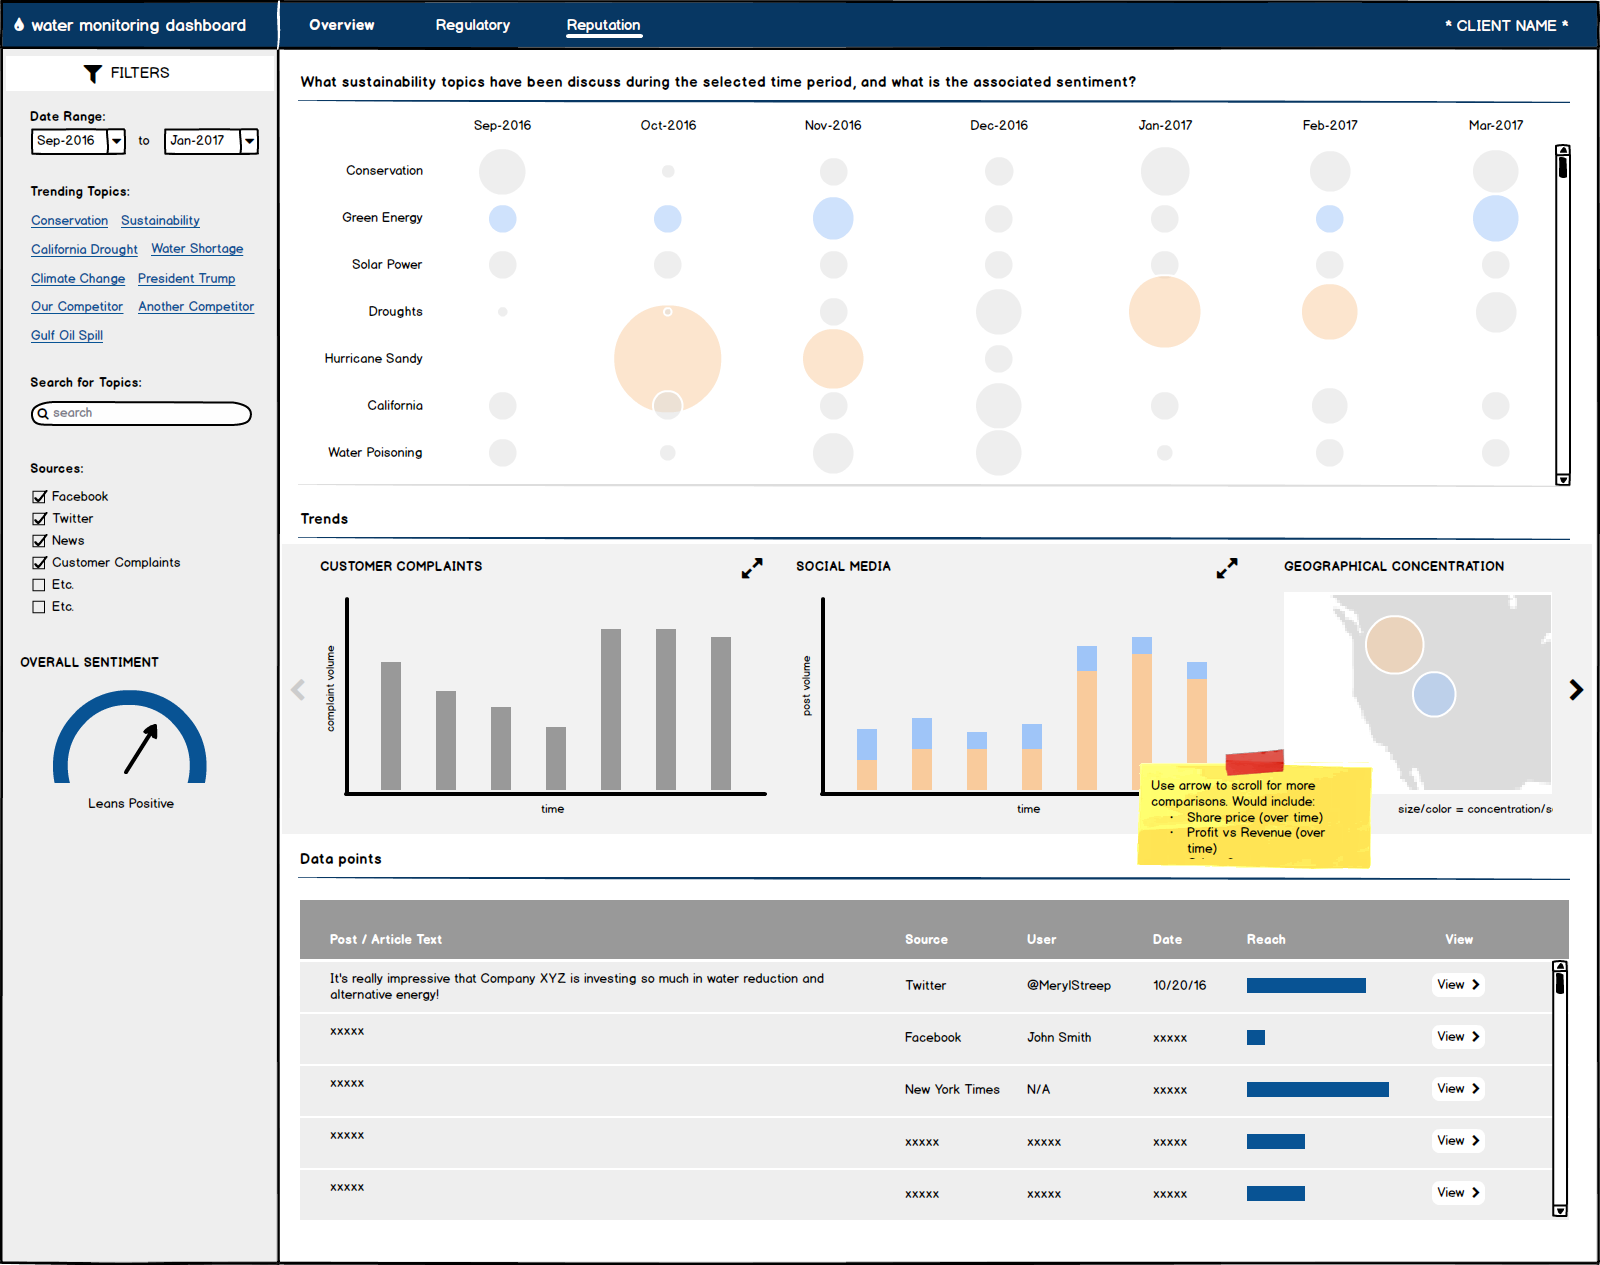
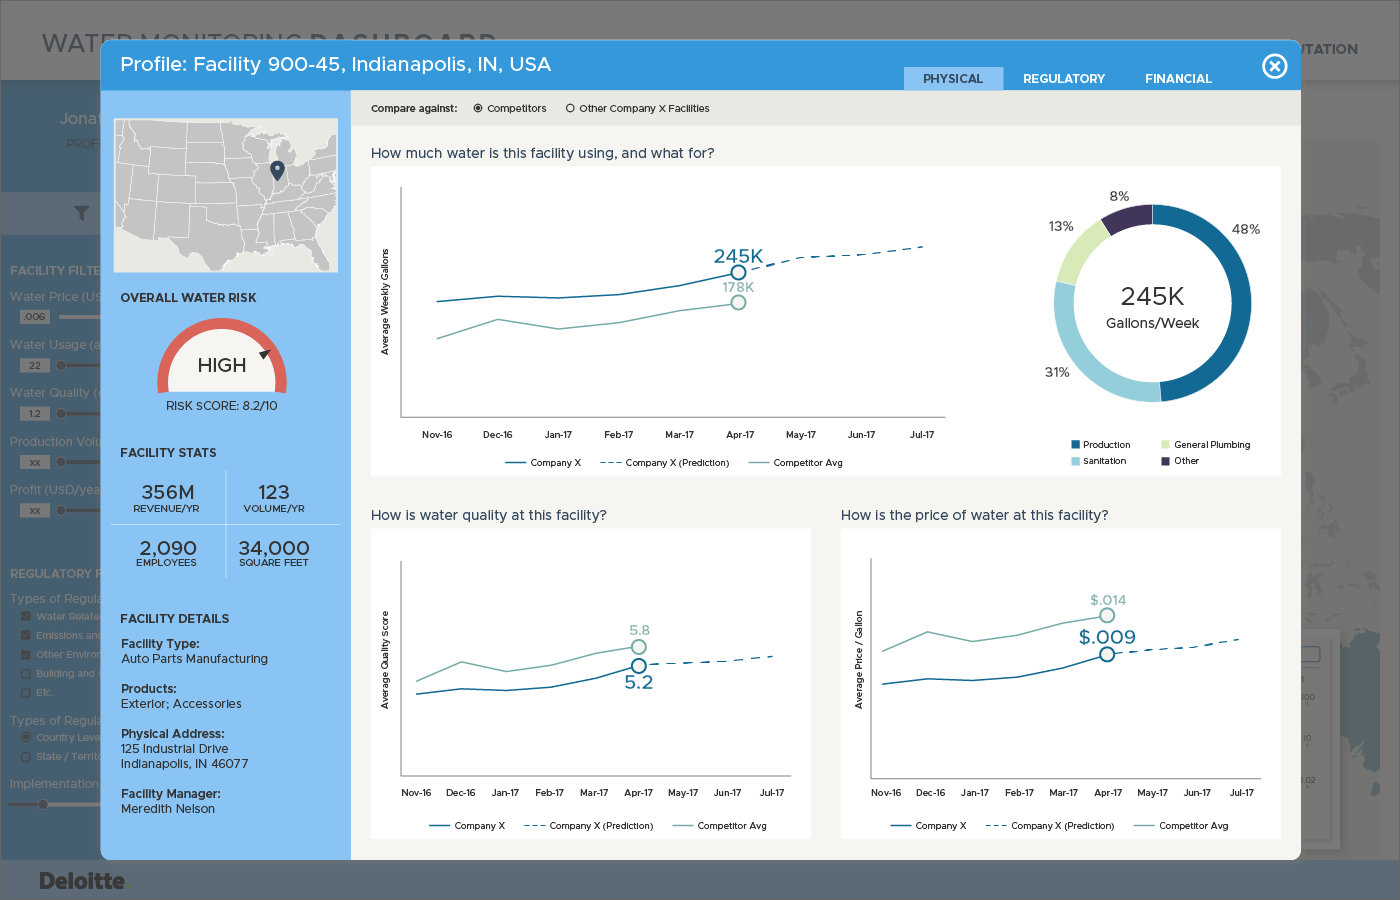
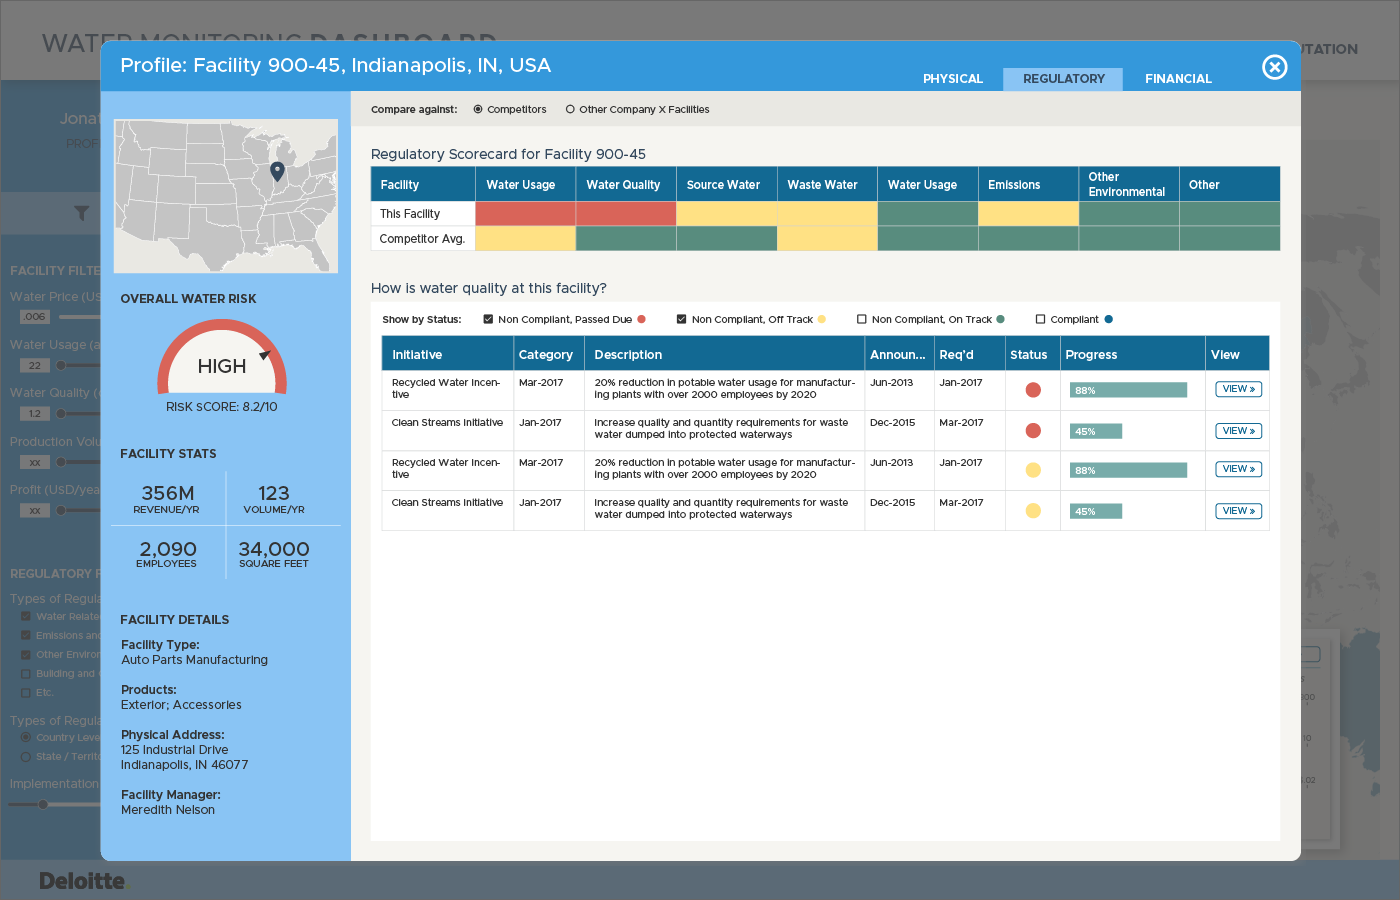
High Fidelity Wireframes and Clickable Demo
After a two-week hustle and some quick iteration within the team, our lead partner presented the concept to the CEO and ultimately won the add-on work for the real thing, slated to begin in 2018. The demo was created in Invision—check it out here!